As we already know, the fourth wave of any impulse can't overlap an ending point of the first wave. However, sometimes an overlap happens when we expect to have an impulse wave. It doesn't mean that we should continue counting an impulse with an overlap between the waves one and four just because there's an Elliott wave pattern which fits this situation.
Diagonals
If you expect wave one or five to form as an impulse, but you see on the chart a 5-wave price movement with an overlap between waves one and four, in most cases there'll be a moment to have a leading diagonal or an ending diagonal. What is the difference between these two patterns?
That's easy. A leading diagonal can form in wave 1 of an impulse or wave A of a zigzag. Simply put, a leading diagonal is the beginning of an impulse or a zigzag.
At the same time, an ending diagonal can form in wave 5 or C. In this article, we're going to find out more about a leading diagonal.
The main rules for a leading diagonal
- This pattern subdivides into 5 waves.
- Wave 2 never ends beyond the starting point of wave 1.
- Wave 3 always breaks the ending point of wave 1.
- Wave 4 usually breaks beyond the ending point of wave 1.
- Wave 5 in the absolute majority of cases breaks the ending point of wave 3.
- Wave 3 can't be the shortest.
- Wave 2 can't be a triangle or a triple three structure.
- Waves 1, 3 and 5 can be formed like impulses or zigzags.
Structure of motive waves
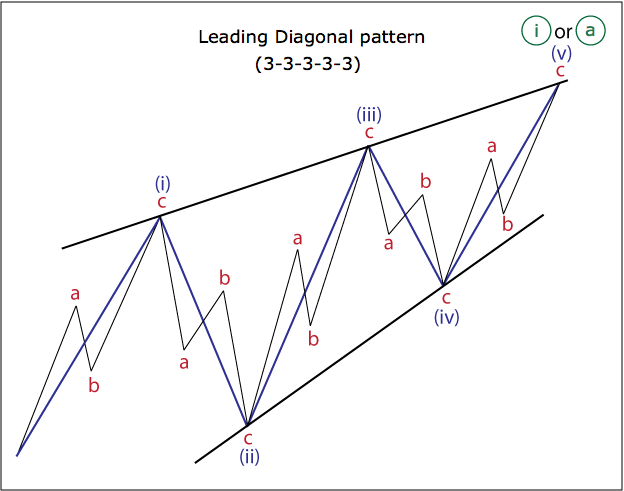
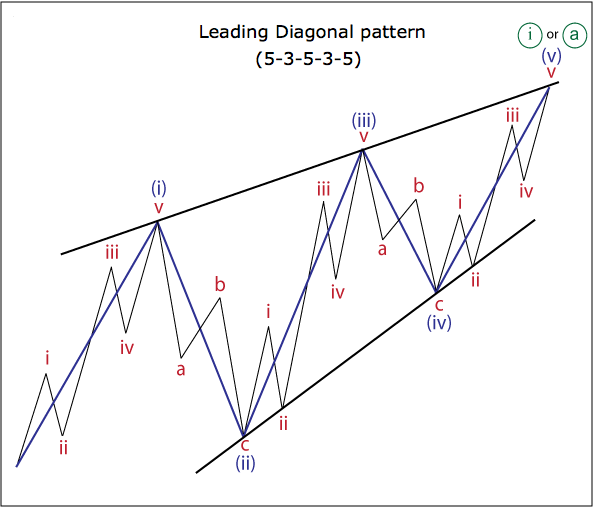
As you can see from the rules above, we can have the motive waves of a leading diagonal as impulses or zigzags. Zigzags are more common, but sometimes there may be impulses in place of waves 1, 3, and 5 instead. In other words, the structure of a leading diagonal usually looks like 3-3-3-3-3, but we can also have this pattern with a different shape of 5-3-5-3-5, which has the same form as an impulse has.
Types of model
There are two types of leading diagonal: contracting and expanding. In most cases, the first wave of a contracting leading diagonal is the longest one and the following third wave is smaller than the first wave. The fifth wave, in turn, is smaller than waves one and three. However, sometimes we can face a contracting leading diagonal with the longest third wave.
Each motive wave of an expanding leading diagonal is longer than the previous one. So, the third wave of this pattern is longer than the first wave and the fifth wave is longer than the third wave. It’s considered that an expanding leading diagonal is riskier than a contracting one.
In the chart below you can see the pattern with a structure as 3-3-3-3-3, so all waves form as zigzags.
The next chart represents a leading diagonal with a shape like 5-3-5-3-5, so the motive waves (1, 3, and 5) are impulses and the corrective waves (2 and 4) are zigzags.
Real example
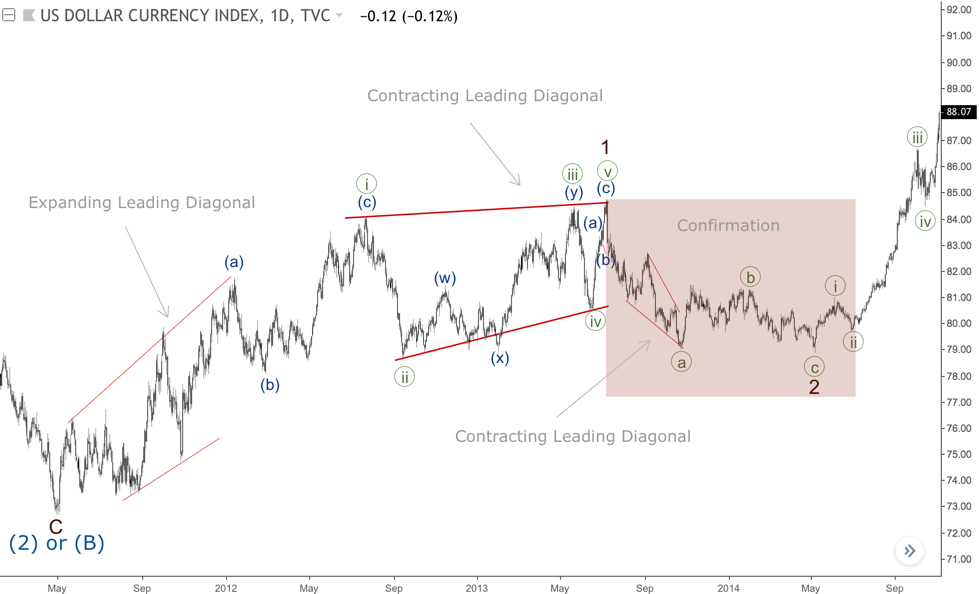
As you can see on the chart below, there are 3 leading diagonals. Firstly, an expanding leading diagonal turned out to be just wave (a) of ((i)) of another leading diagonal in wave 1.
The motive waves of the contracting leading diagonal in wave 1 consist of two zigzags and one double zigzag in wave ((iii)). So, now you know that sometimes it’s possible to have something more complex than a zigzag in a place of the motive waves of a leading diagonal.
Another contracting leading diagonal in wave ((a)) has set up wave 2, which formed as a zigzag.
So, this example perfectly shows that a leading diagonal can be the beginning of a new impulse wave (like the pattern in wave 1) or it can also be the first step into a correction (see the wave ((a)) of 2). Moreover, we can have leading diagonals inside a leading diagonal (see the wave (a) of ((i)).
Confirmation
If a leading diagonal consists of zigzags, we should wait for confirmation. Why? Just because if we have a 5-wave price movement, which subdivides to 5 zigzags, then we can also label this part of the chart as a correction in some different ways depending on the particular case.
So, it's really important to wait for a confirmation before taking any trading actions. If we have a correction after a leading diagonal, and an impulse wave forms next in the direction of the expected third wave (or wave C), then the previously arrived pattern may be considered as confirmed.
Examples of expanding leading diagonals
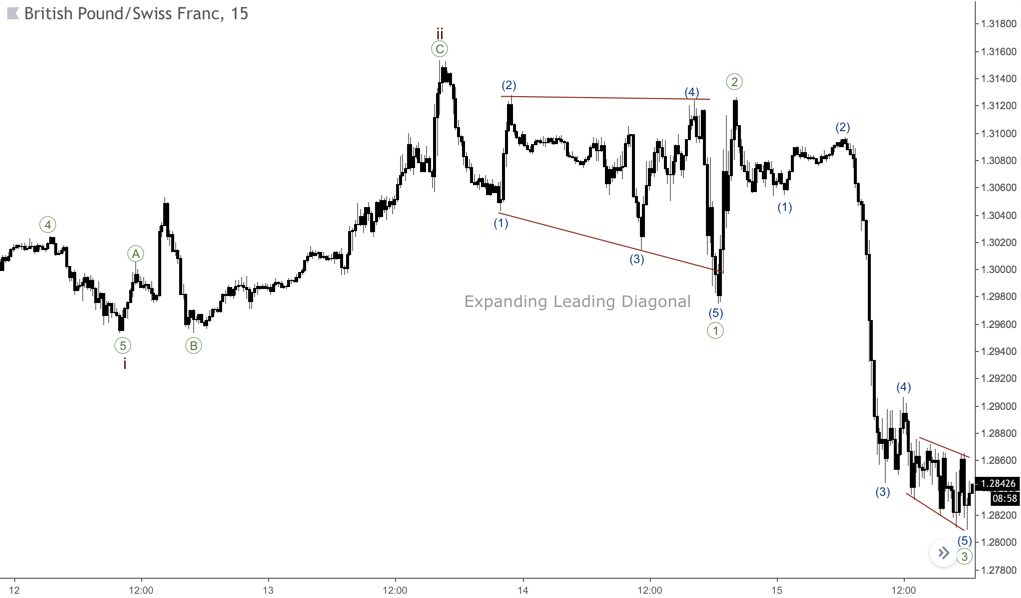
There’s an expanding leading diagonal on the next chart. As you can see, wave ((v)) hasn’t reached the upper side of the pattern. Moments like this happens quite often, so don’t expect the ending of an expanding diagonal near its upper side.
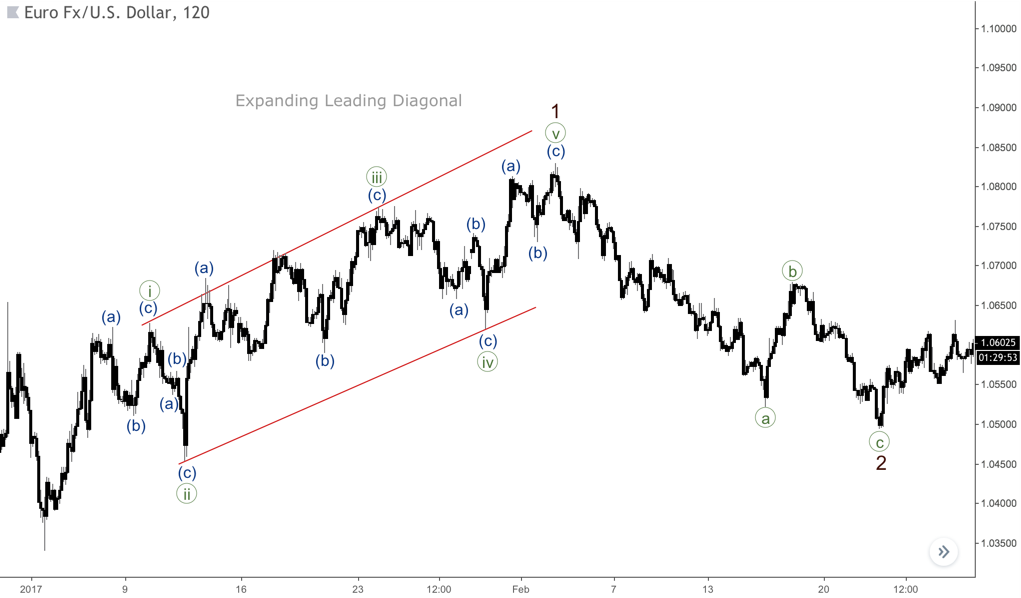
However, occasionally, the fifth wave could break the line from waves one and three. It occurs quite rarely, so it took some time to find the right example of this situation. Usually, this happens while some news or political events are taking place. The expanding leading diagonal you can see below was formed during a long meeting of the British government about the Brexit deal.
Leading diagonals with impulses inside
As we mentioned above, waves one, three and five of a leading diagonal can also be impulses. Just have a look at the chart below. There’s a leading diagonal in wave a, and its motive waves look like impulses.
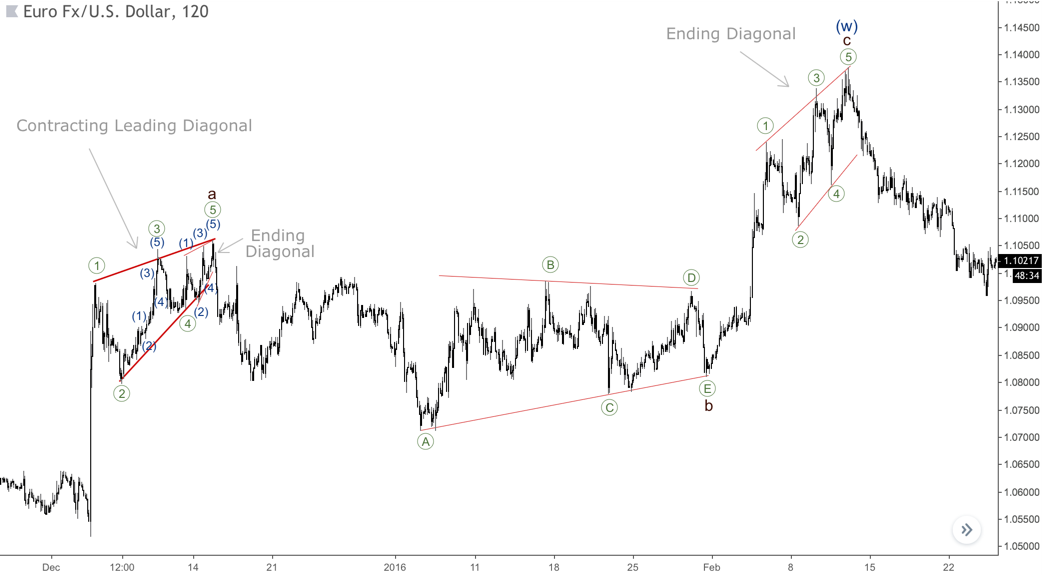
We’re going to examine an ending diagonal in the next article, but you can see the main difference between the two patterns. A leading diagonal kicks off a price movement, while an ending diagonal ends it. Moreover, it’s also possible to have an ending diagonal in the fifth wave of a leading diagonal, if this pattern developing with impulses in motive waves (see the chart above).
The Bottom Line
A leading diagonal is the beginning of an impulse or a zigzag. This pattern can form in two types: 3-3-3-3-3 (more common) or 5-3-5-3-5. A correction takes place right after the ending of a leading diagonal. After this correction, we can expect the third wave of an impulse of wave C of a zigzag, depending on the whole wave count.